A streaming aggregator, in TypeScript and Rust
I built the middle tier of a three-tier monitoring stack twice: once on
pond-ts in Node, then again on pond-rs in Rust. A producer sends
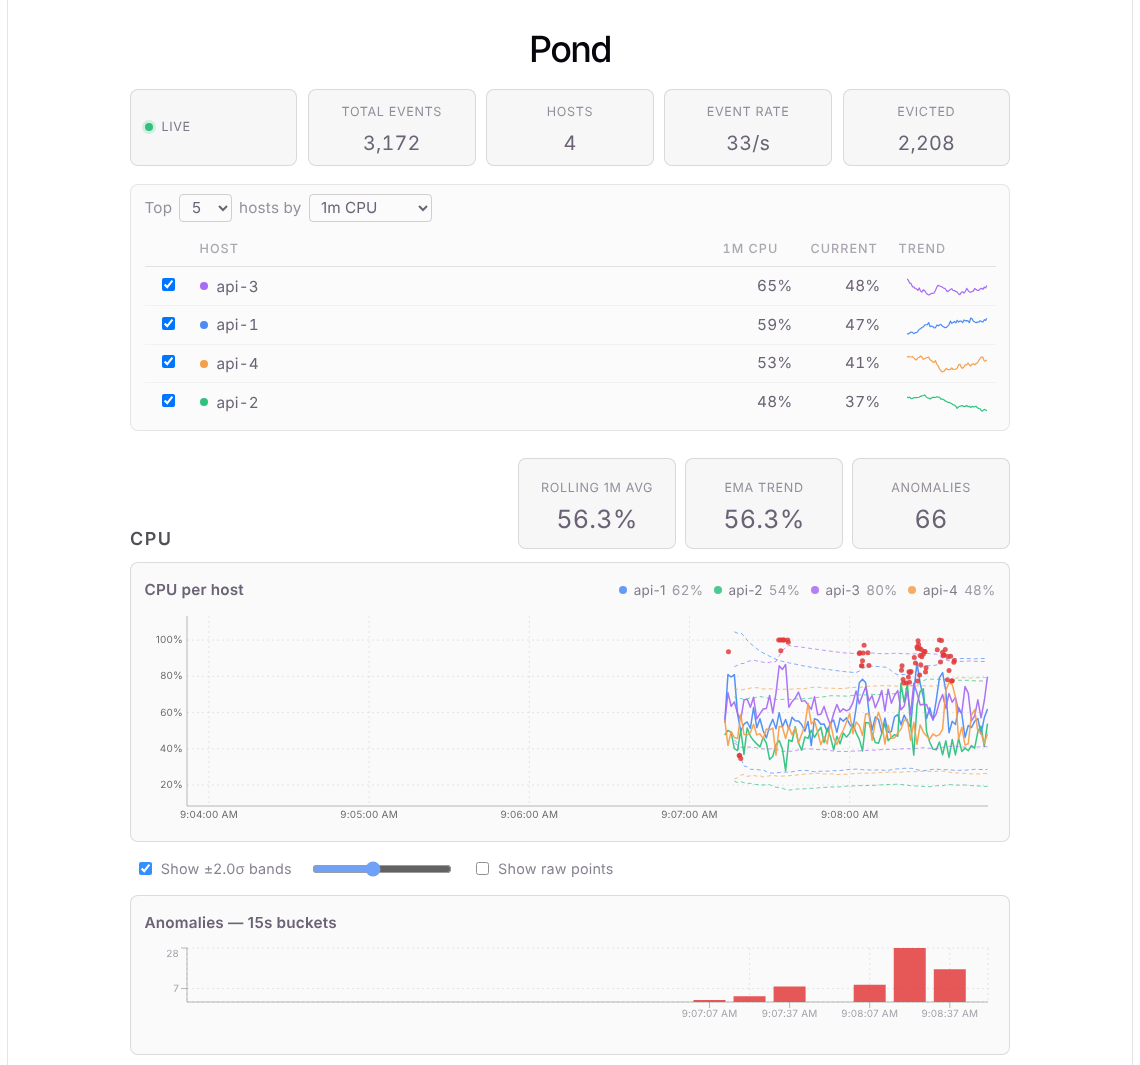
per-host CPU and request metrics over gRPC. The aggregator keeps a
30-second window of the raw events, works out rolling stats for every
host, and pushes both to a browser dashboard over WebSocket. This
guide covers how the pipeline is put together, what changed when it
moved to Rust, and what the two versions measured when I raced them on
the same stream.
All the code is in
pjm17971/pond-grpc-experiment.
File paths in square brackets point at it. The Node aggregator is
packages/aggregator (pond-ts 0.75), the Rust one is
packages/aggregator-rs (pond-rs 0.1 from crates.io), and the
dashboard is packages/web. Both aggregators serve the same endpoints
and the same JSON, so the dashboard doesn't know which one it's
talking to.
┌────────────┐   gRPC stream     ┌──────────────┐   WebSocket     ┌───────────┐
│  producer  │ ────────────────▶ │  aggregator  │ ──────────────▶ │ dashboard │
│ (synthetic │   one batch per   │  LiveSeries  │  /live (raw)    │  React    │
│  metrics)  │   producer tick   │  + rolling   │  /live-agg      │           │
└────────────┘                   └──────────────┘  (per-host)     └───────────┘
1. The events, and how they arrive
Each event has four columns: a time, a CPU fraction, a request count and a host name. In TypeScript the schema is a literal tuple, so every operator downstream knows the column types:
// [packages/shared/src/schema.ts]
export const schema = [
  { name: 'time', kind: 'time' },
  { name: 'cpu', kind: 'number' },
  { name: 'requests', kind: 'number' },
  { name: 'host', kind: 'string' },
] as const;
The producer sends one gRPC message per tick, holding one event per
host (EventBatch in events.proto). That was the first lesson,
learned before any of the pond work: sending one message per event
spent more time in gRPC than in the aggregator. With batches, the
aggregator makes one pushMany call per message, and pond does its
ordering checks, storage and listener calls once per batch instead of
once per row.
2. Ingest: one LiveSeries, one push per message
The aggregator owns a single LiveSeries that keeps the last 30
seconds:
// [packages/aggregator/src/index.ts]
const live = new LiveSeries({
  name: 'metrics',
  schema,
  retention: { maxAge: '30s' },
});
The retention started at 6 minutes. It came down to 90 s and then 30 s, because at ~70k events/s a long window ran Node out of heap. Each event held as a JS object costs a few hundred bytes. The window length you can afford depends on your event rate, and you only find that out under load.
The gRPC handler turns a message into rows and pushes them in one call:
// [packages/aggregator/src/ingest.ts], trimmed
call.on('data', (batch) => {
  const rows = batch.events.map((e) => [
    new Date(e.timeMs),
    e.cpu,
    e.requests,
    e.host,
  ]);
  if (rows.length > 0) live.pushMany(rows);
});
Everything else hangs off live as listeners or derived views. The
raw /live feed is a live.on('batch', …) listener that turns each
batch into an append frame for connected clients. A new client
first gets a snapshot of the whole window, then the appends.
3. Per-host stats on one shared clock
The dashboard doesn't want 100k raw rows a second. It wants, for every host and every 200 ms:
- a 1-minute baseline: average and standard deviation of CPU, and request average, sum and count;
- the last 200 ms slice: the CPU samples themselves, their min, max, average and spread.
From those the aggregator counts how many samples in the slice sit more than 1, 1.5, 2, 2.5 or 3 standard deviations from the baseline. Those counts are the anomaly dots on the chart.
In pond-ts that's a partition plus one rolling with two windows, driven by a clock trigger:
// [packages/aggregator/src/aggregate.ts], trimmed
const trigger = Trigger.clock(Sequence.every('200ms'));

const fused = live.partitionBy('host').rolling(
  {
    '1m': {
      cpu_avg: { from: 'cpu', using: 'avg' },
      cpu_sd: { from: 'cpu', using: 'stdev' },
      cpu_n: { from: 'cpu', using: 'count' },
      requests_avg: { from: 'requests', using: 'avg' },
      requests_sum: { from: 'requests', using: 'sum' },
      requests_n: { from: 'requests', using: 'count' },
    },
    '200ms': {
      cpu_samples: { from: 'cpu', using: 'samples' },
      cpu_min: { from: 'cpu', using: 'min' },
      cpu_max: { from: 'cpu', using: 'max' },
      current_avg: { from: 'cpu', using: 'avg' },
      current_sd: { from: 'cpu', using: 'stdev' },
    },
  },
  { trigger },
);

fused.on('event', (e) => {
  // one row per host per 200 ms boundary, all columns filled
});
Three choices here made the rest easy:
- Both windows in one rolling. Each output row has the baseline and the slice side by side for the same host and the same moment, so there's nothing to join afterwards.
- A clock trigger, not "emit on every event". Without a trigger a
rolling emits on every incoming event, which at 1000 hosts × 100/s
would be 100k rows a second. With
Trigger.clock, every host emits once per boundary. Quiet hosts emit too, so the dashboard gets one complete frame per tick. - The boundary comes from event time. A tick fires when the first event past the boundary arrives, not from a wall-clock timer, so a replay of the same events gives the same rows.
The rows for one boundary all come out of the same push. The
aggregator groups them by timestamp, adds the globals (below) and
sends one aggregate-append frame per tick. It also keeps 5 minutes of
these ticks, so a new client's charts start full.
Thinning at high rates. When a host sends 1000 events a second,
the 1-minute window holds 60k samples per host. SAMPLE_STRIDE=N
inserts .sample({ stride: N }) between partitionBy and rolling,
so each host's rolling sees every Nth event. The raw window and the
totals still see everything.
Totals: event rate, ingested, evicted
The headline numbers come from listeners and a second, unpartitioned rolling on the same clock:
// [packages/aggregator/src/aggregate.ts], trimmed
live.on('batch', (events) => {
  eventsIngested += events.length;
});
live.on('evict', (events) => {
  eventsEvicted += events.length;
});
const perSecond = live.rolling(
  { '1s': { events_per_sec: { from: 'cpu', using: 'count' } } },
  { trigger },
);
4. What actually crosses the wire
The dashboard's footer shows the effect. In my run at a light load (4 hosts × 8 events/s, the command in section 9), it received ~5 frames a second averaging 2.1 KB, with ~6 raw events folded into each frame. At 1000 hosts the fold is far bigger: 100k raw rows a second become 5 frames of 1000 rows. The browser does no rolling of its own. It reads columns off the frame and draws.
5. The same pipeline in Rust
pond-rs has the same live layer: a LiveSeries, views built on top
of it, partitions and rolling windows with triggers. Two things are
different, and both shape the code.
A push returns its results. In pond-rs there are no listeners.
You watch the nodes you care about, and push_many returns a list
of outputs (Output::Batch, Output::Evict, Output::Event) tagged
with the node that produced them. There are no callbacks to keep track
of, and the order is fixed.
Columns are checked when the program runs, not at compile time.
The schema is a list of ColumnDefs, and reading a column
(event.number("cpu_avg")) returns a Result.
The series and the watches:
// [packages/aggregator-rs/src/main.rs]
let mut live = LiveSeries::with_options(
    "metrics",
    vec![
        ColumnDef::required("time", ColumnKind::Time),
        ColumnDef::required("cpu", ColumnKind::Number),
        ColumnDef::required("requests", ColumnKind::Number),
        ColumnDef::required("host", ColumnKind::String),
    ],
    LiveOptions::new().max_age("30s"),
)?;
let root = live.root();
live.watch(root, OutputKind::Batch)?;
The per-host rolling is the same idea in a different spelling:
// [packages/aggregator-rs/src/agg.rs], trimmed
let trigger = Trigger::clock(&Sequence::every("200ms")?)?;
let opts = RollingOptions::new().trigger(trigger).history(History::Off);

let by_host = live.partition_by(root, "host", &PartitionOptions::new().max_events(1))?;
let windows = [
    RollingWindow::new("1m", &[
        Agg::new("cpu_avg", "cpu", Reducer::Avg),
        Agg::new("cpu_sd", "cpu", Reducer::Stdev),
        Agg::new("cpu_n", "cpu", Reducer::Count),
        Agg::new("requests_avg", "requests", Reducer::Avg),
        Agg::new("requests_sum", "requests", Reducer::Sum),
        Agg::new("requests_n", "requests", Reducer::Count),
    ]),
    RollingWindow::new("200ms", &[
        Agg::new("cpu_samples", "cpu", Reducer::Samples),
        Agg::new("cpu_min", "cpu", Reducer::Min),
        Agg::new("cpu_max", "cpu", Reducer::Max),
        Agg::new("current_avg", "cpu", Reducer::Avg),
        Agg::new("current_sd", "cpu", Reducer::Stdev),
    ]),
];
let hosts = live.partition_rolling_windows(by_host, &windows, &opts)?;
live.watch(hosts, OutputKind::Event)?;
Two details:
max_events(1)on the partition. Each rolling keeps its own window, so a partition only needs the event it is routing. Without it every host would hold a second copy of the 30 s window.History::Off: the aggregator reads each rolling row as it comes out and keeps its own 5-minute tick history, so the rolling doesn't need to store its rows too.
Thinning per host goes through per_partition with a closure. That's
more to write than pond-ts's .sample({ stride }), but it works:
let sampled = live.per_partition(by_host, move |live, part| {
    Ok(live.sample(part, Sample::Stride(stride))?.id())
})?;
The gRPC handler pushes a batch and walks what came back:
// [packages/aggregator-rs/src/main.rs], trimmed
let out = inner.live.push_many(rows)?;
inner.agg.observe_main(&out); // totals + per-host rows from `out`
let frame = out.iter().find_map(|o| match o {
    Output::Batch { node, events } if *node == root => Some(wire::append_frame(events)),
    _ => None,
});
for tick in inner.agg.drain_ticks() {
    // one /live-agg frame per completed 200 ms boundary
}
All of this runs while holding one lock, and the frames are sent before the lock is released. A client taking a snapshot then sees each batch exactly once: either in the snapshot or as an append after it.
Did it give the same answers?
A script subscribes both aggregators to one producer and compares every
/live-agg row by timestamp and host
(packages/aggregator/scripts/compare-agg.ts). In three runs where
both started from the same producer event, 7,500 of 7,500 rows were
identical. In three runs where Rust joined the stream one or two producer
ticks earlier, the only differences were that first tick, which held the
extra events, and later standard deviations agreeing to within 1e-12.
That last-digit drift comes from running sums: an event added and then
removed leaves slightly different rounding behind.
An earlier Rust version, before pond-rs had partitions, split the stream by host by hand, with one small series per host. It matched only the first host of each batch. pond-ts emits every host as soon as the first host's event crosses a boundary, before the other hosts' events at that time are added. The hand split emitted each host after its own event. pond-rs partitions copy the pond-ts behaviour, so the difference went away. If you need results that match pond-ts row for row, use the library's partitions rather than your own.
6. When the reader can't keep up
At 1000 hosts × 1000 events/s the producer sends 1M rows a second, far more than the Node aggregator can take. At first the producer gave each subscriber an unbounded queue, so the backlog piled up in producer memory without showing in any metric.
Now each subscriber has a bounded queue of 64 batches; when it's
full the oldest batch is dropped and counted. The Rust producer
reads one tokio broadcast channel. A slow subscriber falls behind in
it and skips ahead (Lagged(n)). The Node producer stops writing when
call.write() returns false, queues until 'drain', and drops the
oldest batch when its queue is full. Both report dropped rows on
/metrics, and the bench shows them as Dropped/s.
In a test with one subscriber paused for 10 s and another reading normally, the paused one lost ~1,800–1,900 batches. The other lost none beyond a few in flight, and producer memory stayed flat. Dropping old data suits a live dashboard, where the last 200 ms matters more than a complete history. A pipeline that must see every row would need the reader to tell the producer how much it can take, which this experiment doesn't build.
7. The race
Both aggregators ran the same sweep: P hosts × N events/s per host,
30 s per run after a 5 s warm-up, two rounds alternating Node and Rust,
the Rust producer feeding both. This was a 4-core cloud container. A
selection, with each cell showing both rounds
(node-vs-rust-race.md has all 12 configs):
| Hosts × events/s | Target rows/s | Node took | Rust took | Node CPU cores | Rust CPU cores | Node MB¹ | Rust MB |
|---|---|---|---|---|---|---|---|
| 10 × 1000 | 10,000 | 9,983 / 9,902 | 10,009 / 10,001 | 0.75 / 0.73 | 0.13 / 0.13 | 276 / 272 | 44 / 43 |
| 1000 × 10 | 10,000 | 10,021 / 10,008 | 10,019 / 9,994 | 0.34 / 0.31 | 0.05 / 0.05 | 469 / 469 | 118 / 117 |
| 100 × 1000 | 100,000 | 34,363 / 35,031 | 99,974 / 99,987 | 0.84 / 0.82 | 0.29 / 0.29 | 713 / 725 | 383 / 382 |
| 1000 × 100 | 100,000 | 34,732 / 34,538 | 99,942 / 99,939 | 0.95 / 0.99 | 0.42 / 0.44 | 862 / 947 | 449 / 444 |
| 1000 × 1000 | 1,000,000 | 34,357 / 34,131 | 231,863 / 237,275 | 0.97 / 0.95 | 1.04 / 1.04 | 1001 / 872 | 1047 / 1059 |
¹ Node's figure is the JS heap only; Rust's is the whole process. Node's real footprint is higher than shown.
What it says:
- Up to 10k rows/s both keep up. Where the CPU readings are big enough to compare, Rust uses 3–7x less CPU. It uses a sixth to two-fifths of the memory, even against Node's heap alone. (At 1000 × 1000 Rust's memory is similar to Node's heap because it holds seven times as many rows.)
- Node tops out at ~34–35k rows/s here and drops ~65% of a 100k stream. Rust takes all of it on under half a core.
- At 1M rows/s Rust takes ~232–237k, about 7x Node, and then it is the limit. Its ingest runs on one thread: the gRPC read, the push, both frames and the broadcast all happen in turn under one lock. Splitting frame-writing off that thread is the obvious next step if you need more.
On a laptop (M1 Pro, 1000 × 1000) the gap was smaller: Rust 434–564k rows/s, Node 109–127k (3.4–5.2x).
The Node numbers are on pond-ts 0.75. Partitioned live pipelines got
slower in pond-ts 0.20 (about 22% at 1000 × 1000, measured 0.19 against
0.20), because partitions took rows one at a time. All told, 0.75 was
15–33% slower than 0.17 at the loads that push it. The fix ([PND-PARTBATCH], #838) is on main but not in a
release yet, so expect Node to do somewhat better on the next one.
Measure latency the same way on both sides
The first race said Rust's slowest 1% of batches took 25–27 ms at 1000 × 100, against Node's 7.6–14.7 ms. That looked wrong, since Node was dropping two-thirds of the stream at the time. It was wrong: the two aggregators were timing different things.
- Node stopped the clock before building and sending the frame. It
left out the per-host tick, which runs in a microtask after
pushMany. It also took one sample per event, so its 1024-sample history held about the last batch. - Rust stopped the clock after everything, with one sample per batch, so its history covered ~10 s.
Both now report batchDoneMs: one sample per gRPC batch, from the
handler starting to all of that batch's work finishing. Measured that
way at 1000 × 100:
| Rows/s taken | Batch done, typical | Batch done, slowest 1% | |
|---|---|---|---|
| Node | 27–29k (dropping ~72%) | 22 ms | 66–79 ms |
| Rust | 100k | 6.3 ms | 21–22 ms |
Rust's slowest 1% are the one-in-20 batches that cross a 200 ms
boundary. Those also emit 1000 per-host rows and build the 1000-row
tick frame: ~15 ms, against ~5.5 ms for an ordinary batch. A profile
showed no single hot spot. The biggest share (38% of instructions)
goes to routing rows to their host and updating each host's windows. The full write-up is in
latency-p99.md.
The lesson applies to any comparison: before comparing a number from two systems, check that both start and stop the clock at the same points and count the same thing.
8. Sharp edges I hit
- A window name built from a number (
`${tickMs}ms`) makes the TypeScript output column type too wide to annotate. With literal window names it type-checks; here I dropped the annotation. - The Rust
samplesreducer returns a list ofScalars, which the aggregator converts to numbers before counting anomalies. - Rolling standard deviations agree to ~1e-12, not bit for bit, between two aggregators that started at different points in the stream. Compare with a tolerance.
- Bench noise on a shared machine is real. Single runs of the same build swung the slowest-1% figure between 20 and 32 ms. Alternate the builds you're comparing and run each more than once.
- Not covered: late or out-of-order events, gaps, and reconnects under load. The producer always sends every host on every tick, in time order.
9. Running it yourself
git clone https://github.com/pjm17971/pond-grpc-experiment
cd pond-grpc-experiment
pnpm install && pnpm codegen

# Rust producer and aggregator (needs protoc and a Rust toolchain)
(cd packages/producer-rs && cargo build --release)
(cd packages/aggregator-rs && cargo build --release)

# terminal 1: producer
(cd packages/producer-rs && GRPC_PORT=50051 EVENTS_PER_SEC=8 HOST_COUNT=4 ./target/release/producer-rs)
# terminal 2: aggregator
(cd packages/aggregator-rs && AGGREGATOR_PORT=8080 PRODUCER_URL=localhost:50051 ./target/release/aggregator-rs)
# terminal 3: dashboard on http://localhost:5173/
pnpm dev:web
Use pnpm dev instead to run the all-Node stack. To race the two
aggregators yourself, run packages/aggregator/scripts/race.sh [seconds] [rounds]. pnpm bench:dev --P=1000 --N=100 runs a single load.
For the libraries themselves: pond-ts live series and the pond-rs live layer.